|
See Average Run Length
The number of points that, on average, will be plotted on a control chart before an out of control condition is indicated (for example a point plotting outside the control limits).
If the process is in control:

If the process is out of control:

Where a is the probability of a Type I error and b the probability of a Type II error.
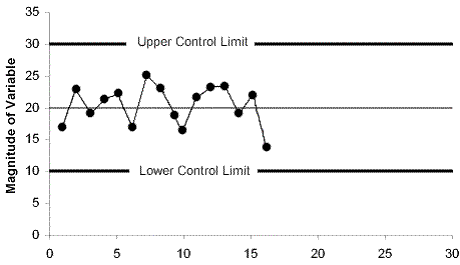
A procedure used to track a process against time for the purpose of identifying 'special causes', or sporadic or chronic problems in a timely fashion. The control chart has control limits, usually at three standard deviations from the mean. Special causes are indicated by points plotting outside the control limits, or various other patterns of points:

An "In-Control" process is one that is free of special causes of variation. Control charts are used to monitor processes to check that they remain in-control, and to give timely notification of a special cause.
Note that "In-Control" does not necessarily mean that a process is performing at an acceptable level. It is quite possible, and common, for a process to be stable and free of special causes but producing output of unacceptable quality.
Samples should be collected so that, if special causes are present, the chances for variation within subgroups is minimized but the chances for variation between subgroups is maximized.
The items within a subgroup should be collected closely together, and may be consecutive items. The items within a subgroup should not be collected across a shift change, or across any other process change that may be associated with a special cause.
Shewhart invented control charts and control charts are often called Shewhart Control Charts. See Control Chart
See Statistical Process Control
| Statistical Process Control |
|
The application of statistical methods to achieve timely identification of special causes of variation. The main toll of SPC is the control chart.
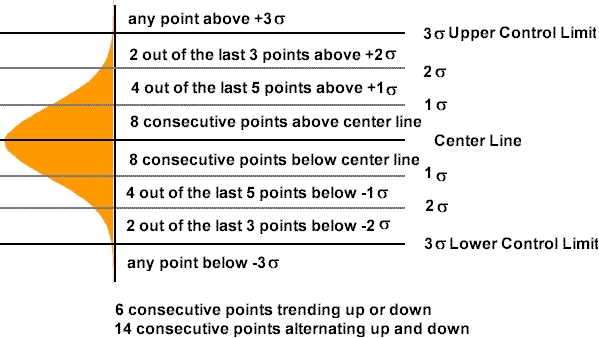
The rules from the Western Electric Company handbook are often used to signify 'special causes' on control charts:

|