|
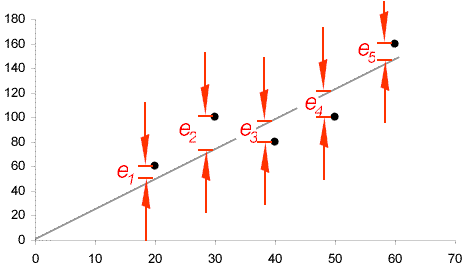
The regression line through a set of points is placed at the position that minimizes the sum of the squares of the deviations of the points from the line:

Linear regression uses a linear regression model:

The parameters can be found from:
Where:
Logistics Regression is used to create the relationship between a probability and a quantity. The mathematics are too complex to describe, use Minitab or other statistical package.
The type of question that it answers is:
At a call center that provides insurance quotations callers are put on hold if an operator is not available. Some callers hang up. Data on calls showing where the calls are abandoned:
|
|
Wait
|
Abandon
|
|
Wait
|
Abandon
|
Wait
|
Abandon
|
|
|
1
|
10
|
N
|
11
|
28
|
N
|
21
|
60
|
N
|
|
2
|
12
|
N
|
12
|
29
|
N
|
22
|
64
|
Y
|
|
3
|
15
|
N
|
13
|
35
|
Y
|
23
|
68
|
Y
|
|
4
|
18
|
N
|
14
|
38
|
Y
|
24
|
75
|
N
|
|
5
|
18
|
N
|
15
|
42
|
N
|
25
|
80
|
N
|
|
6
|
20
|
N
|
16
|
43
|
N
|
26
|
86
|
N
|
|
7
|
22
|
N
|
17
|
44
|
N
|
27
|
89
|
Y
|
|
8
|
26
|
N
|
18
|
49
|
Y
|
28
|
92
|
N
|
|
9
|
27
|
Y
|
19
|
50
|
N
|
29
|
97
|
Y
|
|
10
|
27
|
N
|
20
|
52
|
Y
|
30
|
100
|
Y
|
(a real dataset would include many more results).
Linear regression will give a regression equation for the probability of a caller abandoning the calls against wait time.
| Multiple Linear Regression |
|
A linear regression model that relates the response to several inputs:

Regression analysis involves finding the line of best fit through a series of points. See Linear Regression for more information.
The difference between the value obtained from the process and the value predicted by the regression model. Residual analysis is an important part of the analysis in experimental design because, for the results to be valid, the residuals should conform to a normal distribution (note that experimental design is a specialized form of regression analysis)..
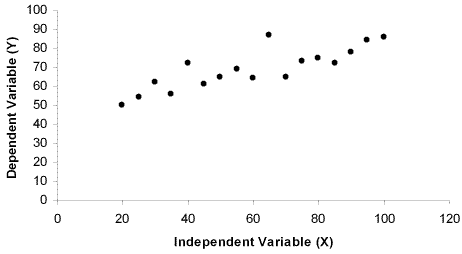
A scatter plot is a plot of one variable against another. The 'y' (vertical) axis is the dependent variable and the 'x' axis is the independent variable:

|