|
A Bimodal distribution has two peaks. It occurs when the output from two process streams are mixed, thus combining two distributions. Each individual process stream often conforms to a normal distribution.
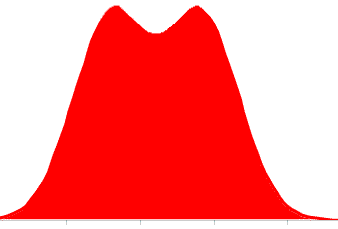
An example could be when the output from two similar machines, each set to a slightly different size, is mixed.
| Bivariate Probability Distribution |
|
The Bivariate distribution shows the joint probability distribution of two random variables. The bivariate distribution forms a three dimensional surface.
Suppose that the position of the center of a hole can vary in both the x and y directions. The distribution of the center position in both the x and y directions conforming to a normal distribution.
A distribution of the hole center positions would conform to a bivariate normal distribution. If the standard deviations in x and y were the same then the surface formed would be a bivariate normal distribution. The shape of the surface would depend on the standard deviation in the x and y directions, and whether x any y were correlated.
A statistical distribution with the pdf:

The symbol 'G' is the 'Gamma Function'.
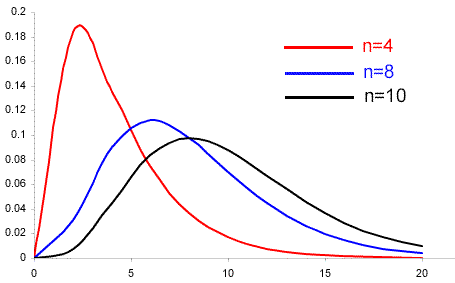
The chi-square distribution is used for the chi-square goodness of fit test.
A distribution used to describe the probability of a response when the output is continuous (variable) data.
| Cumulative Distribution Function (cdf) |
|
Cumulative Distribution Function. The mathematical function that gives the cumulative proportion of a distribution:
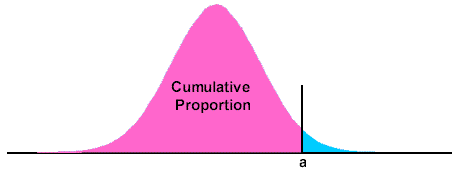
For a normal distribution the cdf is:

This cannot be easily solved, and so normal distribution tables, or computers are used.
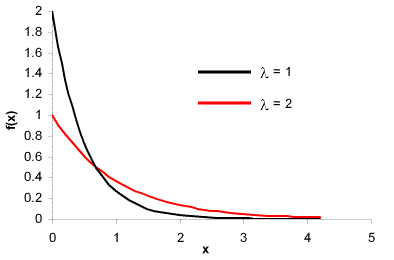
The exponential distribution is represented by:

The exponential distribution is closely related to the Poisson distribution, and is also used for reliability engineering. It models situations where the failure rate is constant. This occurs in the 'useful life' phase, when the item concerned will operate until it is affected by some external factor.
An example would be tire punctures. Most punctures are caused by objects on the road and the likelihood of a puncture is constant as long as the tread is not badly worn, at which time the tire is hopefully discarded.
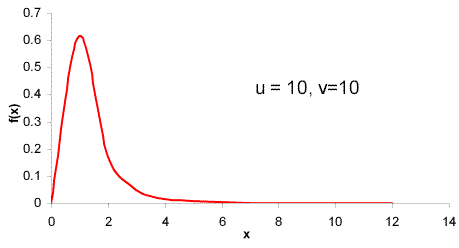
A distribution that is used to test the hypothesis concerning sample variances. The F Distribution is formed from the ratios of two chi-squared variables. If X1 and X2 are independent chi-square variables then:

The pdf is:
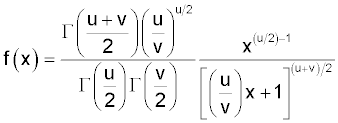
Very few people can calculate f(x) using mental arithmetic.
An alternative name for the Normal Distribution, see Normal Distribution
Kurtosis is the degree of 'peakedness' of a distribution. It is calculated from the formula:

The '3' is included in the formula to give the normal distribution a kurtosis of zero (some published versions do not include it).
A distribution with a kurtosis greater than zero is more peaky than a normal distribution and is 'Leptokurtic'. A distribution that is flatter than a normal distribution is 'Platykurtic'.
The lognormal distribution has the pdf:

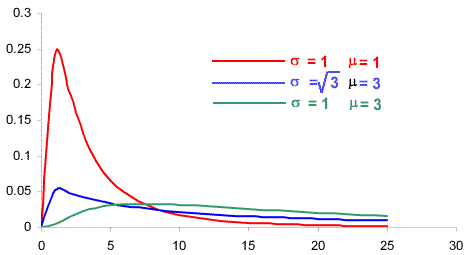
The lognormal distribution is often used for modeling material properties.
The normal distribution (also known as the Gaussian distribution) is a continuous probability distribution. Most processes that are 'in control' conform to a normal distribution, or to some variant of it. Normality is also a condition of many statistical tests.
The normal distribution has a 'bell shape':
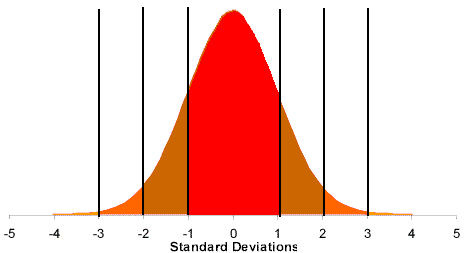
The proportion of the process output that falls within a range of values is represented by the area of the curve. Values are:
| Between -1 and +1 Standard Deviation |
68.3% (about two thirds) |
| Between -2 and +2 Standard Deviation |
95.5% (about 95%) |
| Between -3 and +3 Standard Deviation |
99.7% |
All values can be obtained from the Normal Distribution Tables.
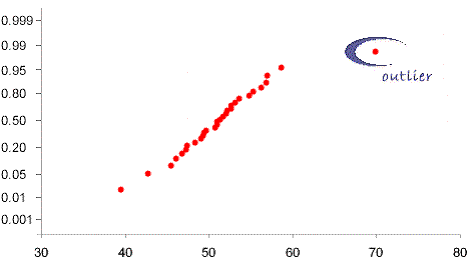
A graphical method for testing normality and identifying points that do not conform to the normal distribution. The values are plotted on a special graph paper called 'Normal Probability Paper' that has the 'y' axis stretched so that points that conform to a normal distribution will form a straight line:
| Probability Distribution Function (pdf) |
|
Probability Distribution Function. The equation that describes the distribution. The pdf gives the height of the distribution:


See t Distribution
The t distribution has the probability distribution function:

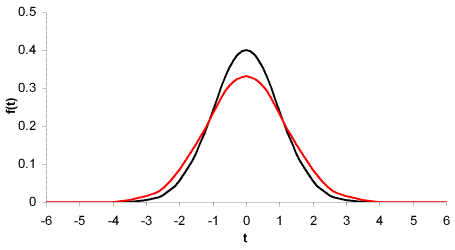
The shape of the t distribution is similar to the normal distribution, and converges on the normal distribution as the number of degrees of freedom increases:
A distribution that has a single local maximum (cf bimodal distribution).
The Weibull distribution is a very flexible distribution. It is useful in reliability engineering because the parameters can be tailored to suit the product characteristics, particularly in the infant mortality and wearout phases of products:

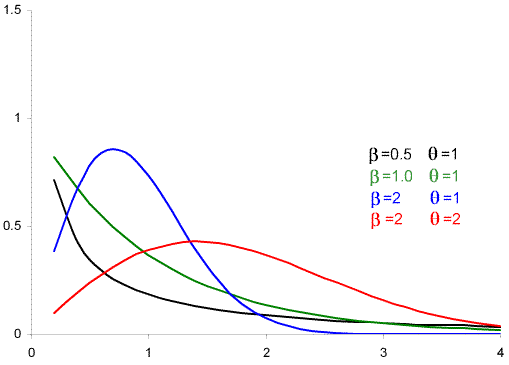
The parameters may be based on a theoretical model, but are often just those that best fit the data.
A graphical technique to determine if a data set comes from a 2 parameter Weibull distribution. The Weibull plot has non-linear scales that are arranged so that if the data set does conform to a normal distribution the points will form a fairly straight line.
The Normal Probability Plot is a similar concept.
|